A REALISTIC COVID -19 DASHBOARD
We purposefully ignore case counts. Case counts are currently a function of testing, and there is no accurate way to determine a positivity rate of a population - unless you have large enough representative samples that allow you to test the entire population within that sample. Current laws do not allow the state to compel everyone in a town or county to be tested. Without testing everyone in a known representative district will significantly skew the results to make them worthless.
We have no way of accurately estimating how many persons in Ohio may have the COVID-19 virus. Any guesstimation is irresponsible.
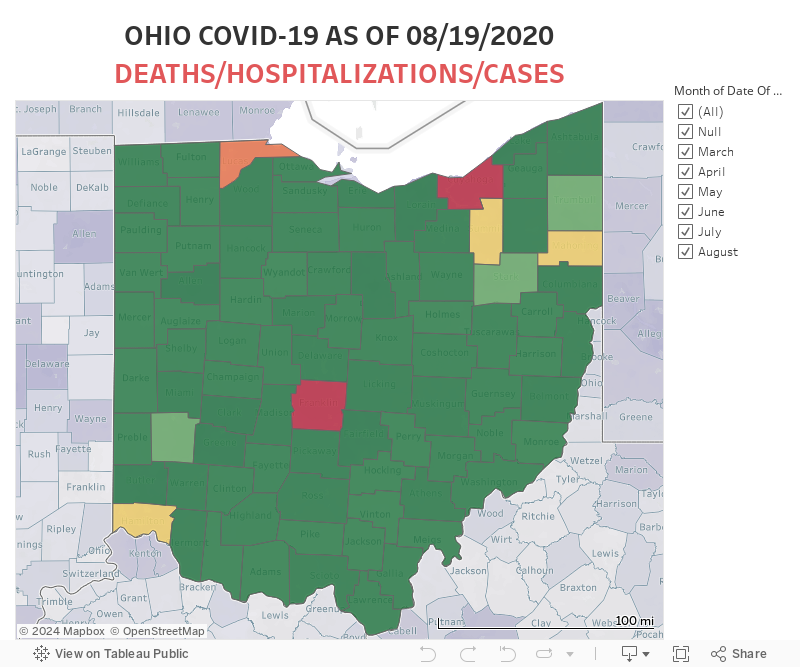
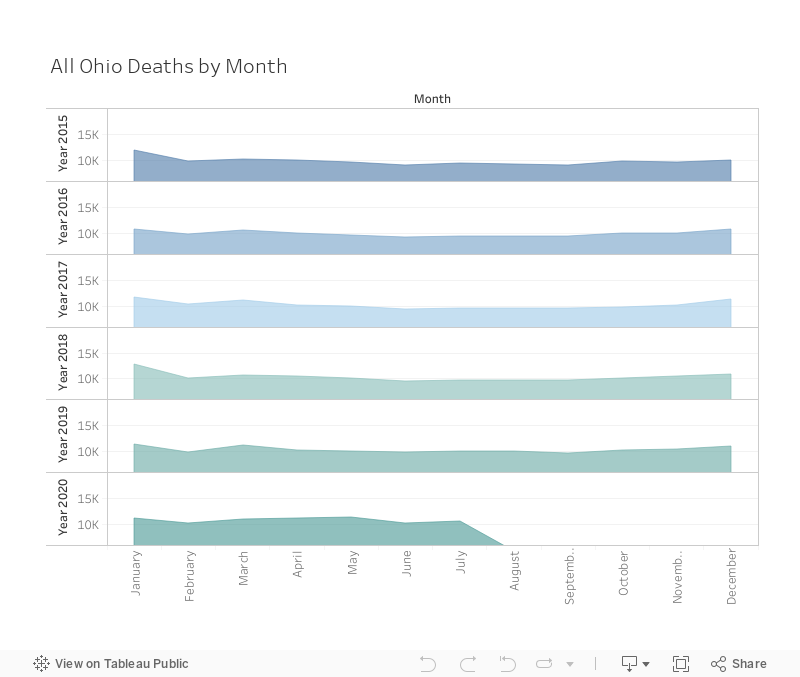
Death counts are pretty reliable. It is very hard to fake a death. It is easy to miscount cases but very hard to miscount deaths. So we concentrate on deaths. With that being said we do not know how accurate these numbers are either as we cannot determine if a person died from COVID-19 or with COVID-19. Death count is the most important number. People naturally want to know whether or not they will die from COVID-19. Obviously, knowing those that died from COVID-19 rather than with COVID-19 is very important. In all cases, every age range has more of a chance of dying from a car or motorcycle accident. Yet, we have not declared a state of emergency due to car and motorcycle accidents.
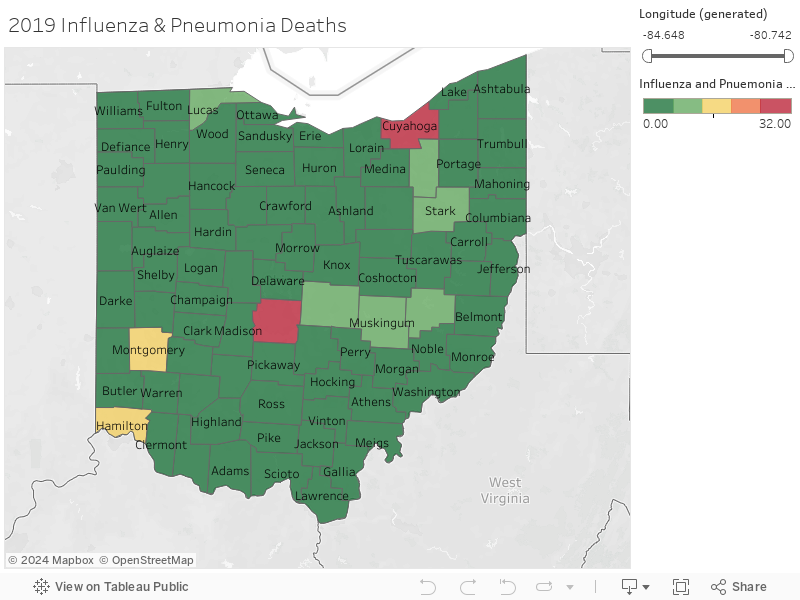
COVID-19 is not the flu. While there are a lot of problems with the data being provided from the Governor and the Ohio Department of Health - it is safe to say that COVID-19 is much deadlier overall than the flu. This is not to say you should upend your life over this, your risk of death or sickness is still very small. If you are in an at-risk group you should absolutely take precautions. If you are at-risk you should be wearing an N95 mask, you should wear gloves when appropriate, you should carry sanitizer, you should learn to not to touch your face, you should be careful of any delivered packages, you should avoid public restrooms when possible.
ODDS OF DYING FROM COVID-19 BY AGE GROUP
0-19
YEARS OF AGE
6.9 in 10 million
20-29
YEARS OF AGE
8.37 in 1 million
30-39
YEARS OF AGE
2 in 100,000
40-49
YEARS OF AGE
4.7 in 100,000
50-59
YEARS OF AGE
1.5 in 10,000
60-69
YEARS OF AGE
3.8 in 10,000
70-79
YEARS OF AGE
1 in 1,000
80+
YEARS OF AGE
4.2 in 1,000
PUTTING IT INTO PERSPECTIVE
Odds of winning the Ohio Lottery
1 in 13 million
Odds of being struck by lightning
1 in 180,746
Odds of dying in an Earthquake
1 in 159,890
Odds of a Royal Flush
1.5 in 100,000
Odds of death from accidental firearms discharge
1 in 9,077
Odds of an Accidental Drug Poisoning
1 in 5,554
Odds of Dying on a Motorcycle
1 in 890
Odds of Dying in a Car Accident
1 in 106
CHANCE OF SURVIVING COVID-19 BY AGE GROUP IN OHIO
0-19
YEARS OF AGE
99.999931%
20-29
YEARS OF AGE
99.999163%
30-39
YEARS OF AGE
99.997937%
40-49
YEARS OF AGE
99.995310%
50-59
YEARS OF AGE
99.984608%
60-69
YEARS OF AGE
99.962186%
70-79
YEARS OF AGE
99.887441%
80+
YEARS OF AGE
99.575389%